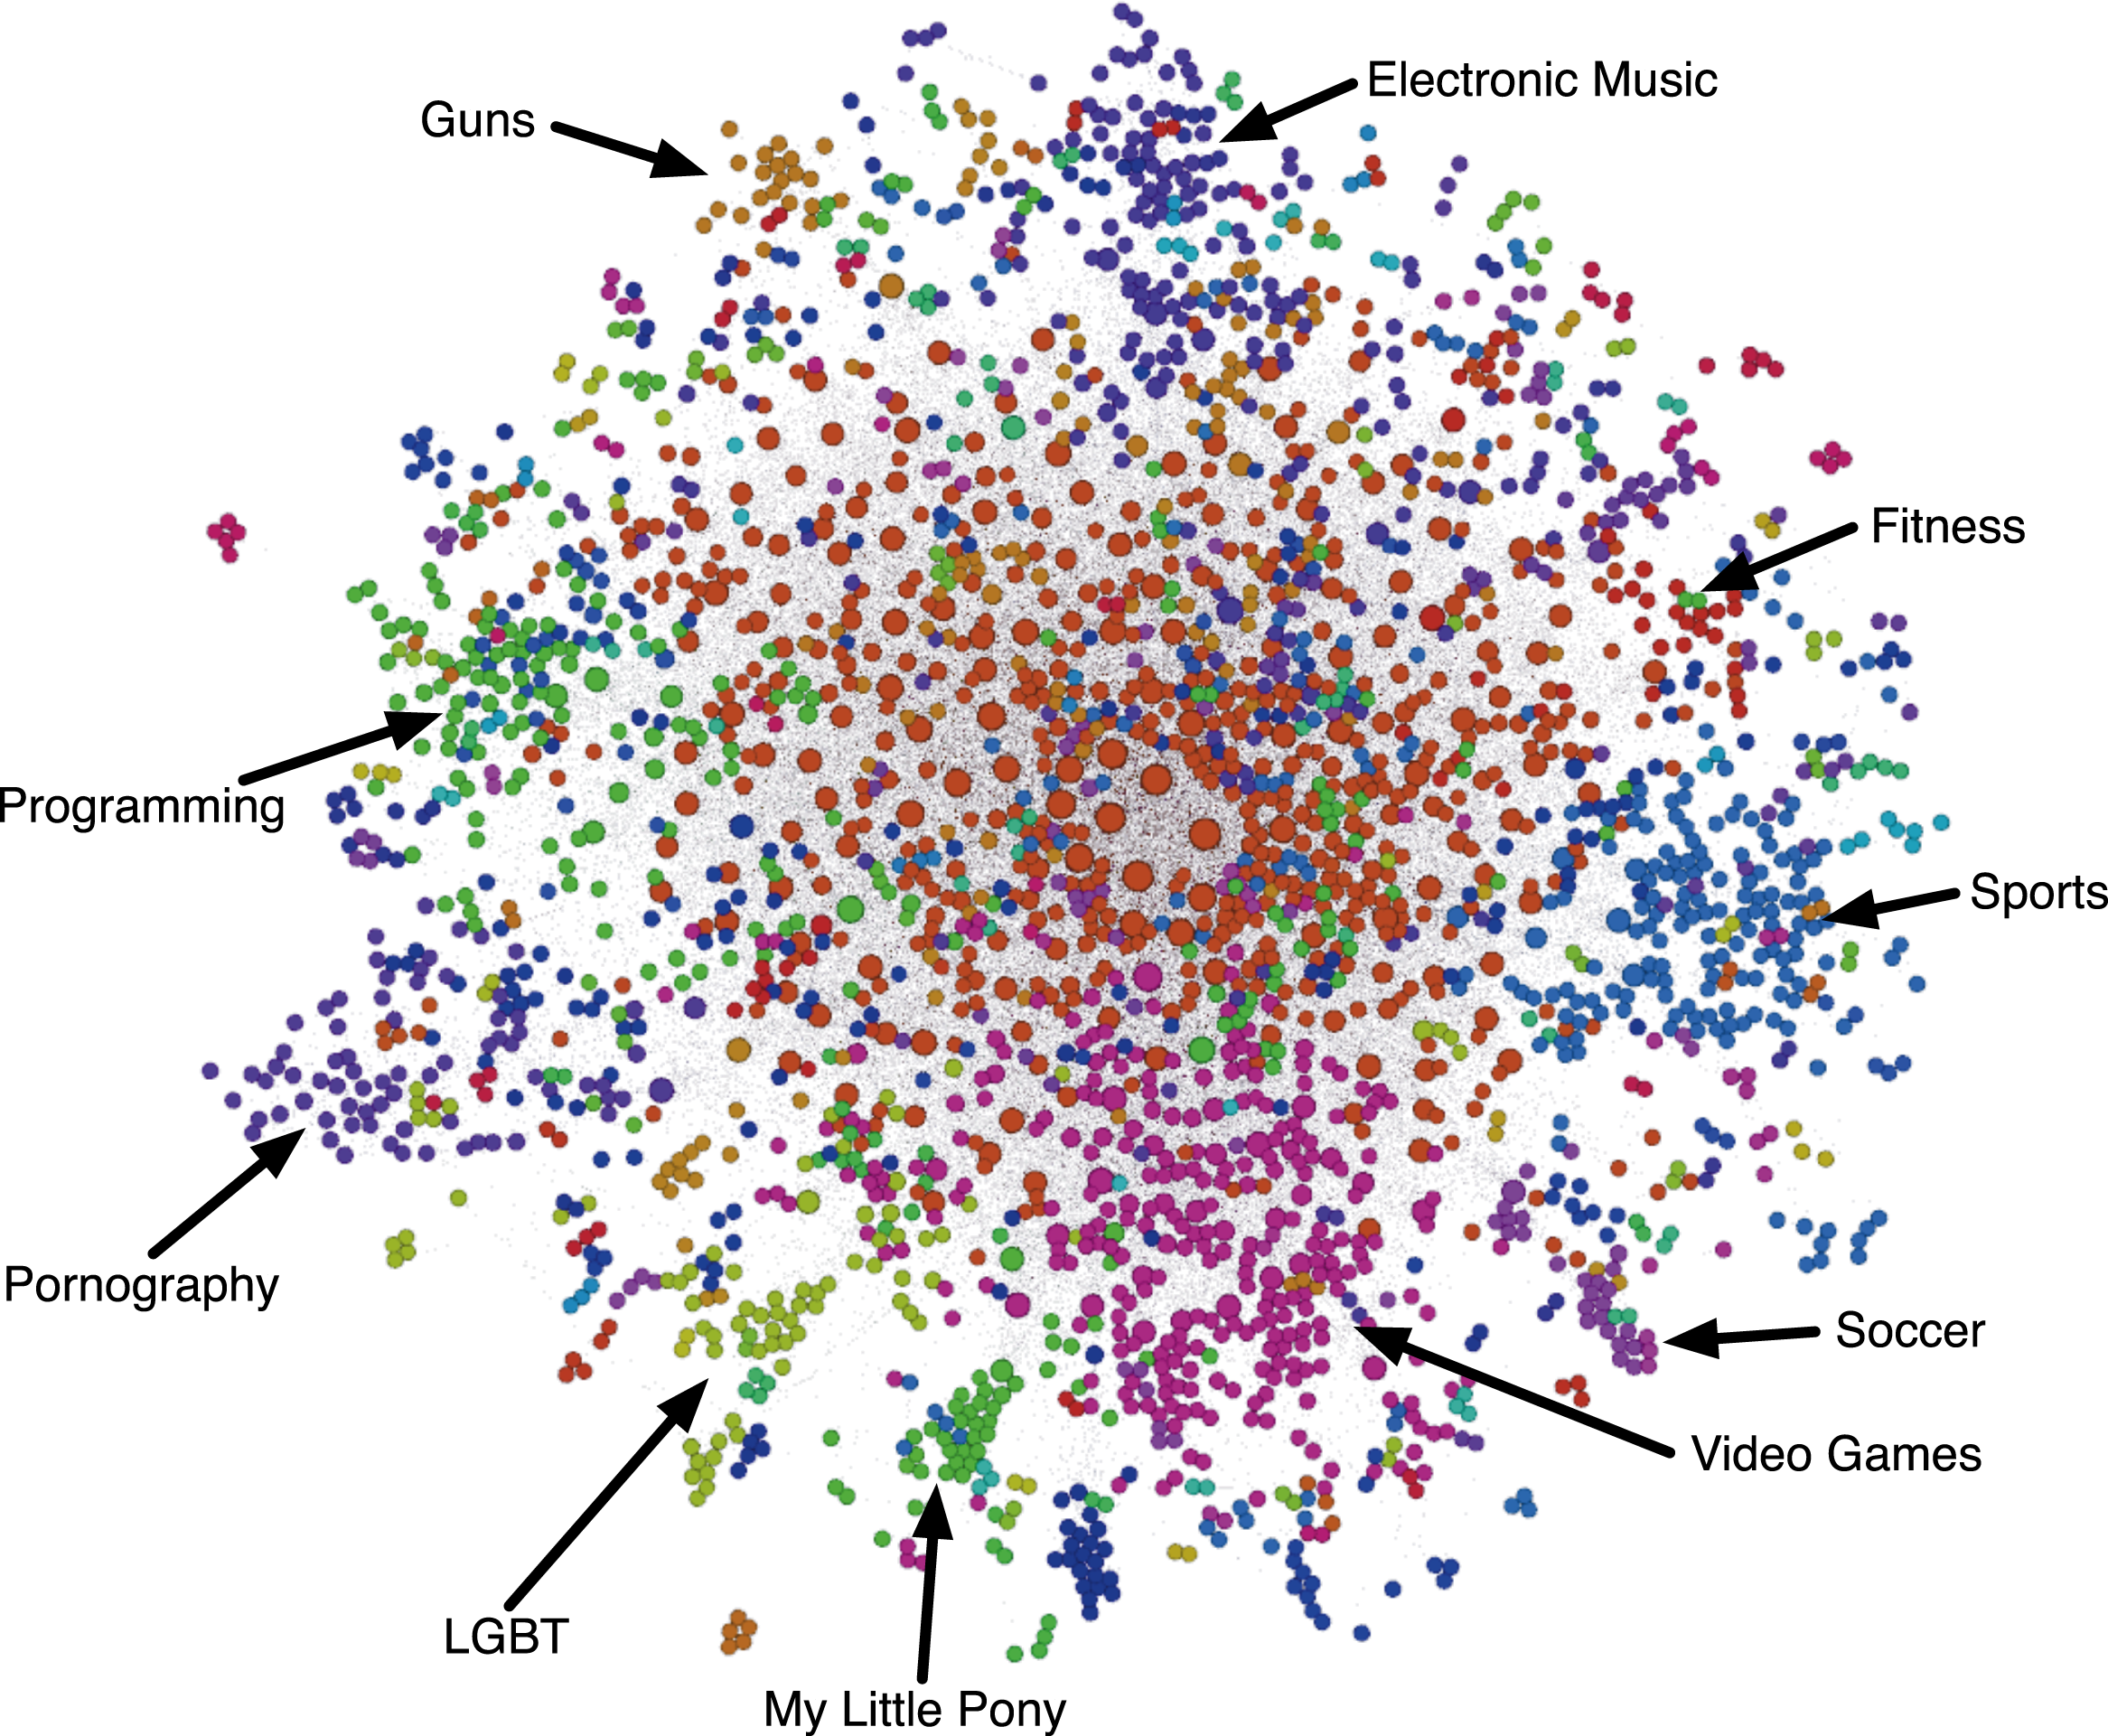
As time goes by, network analysis is the last material of this course. Networks are very important because they help us understand many different kinds of phenomenon such as information diffusion, disease propagation, and relationship formation among customers. And network analysis is very helpful to construct a visualization and tell us a lot of interesting things about the communities involved in the network.
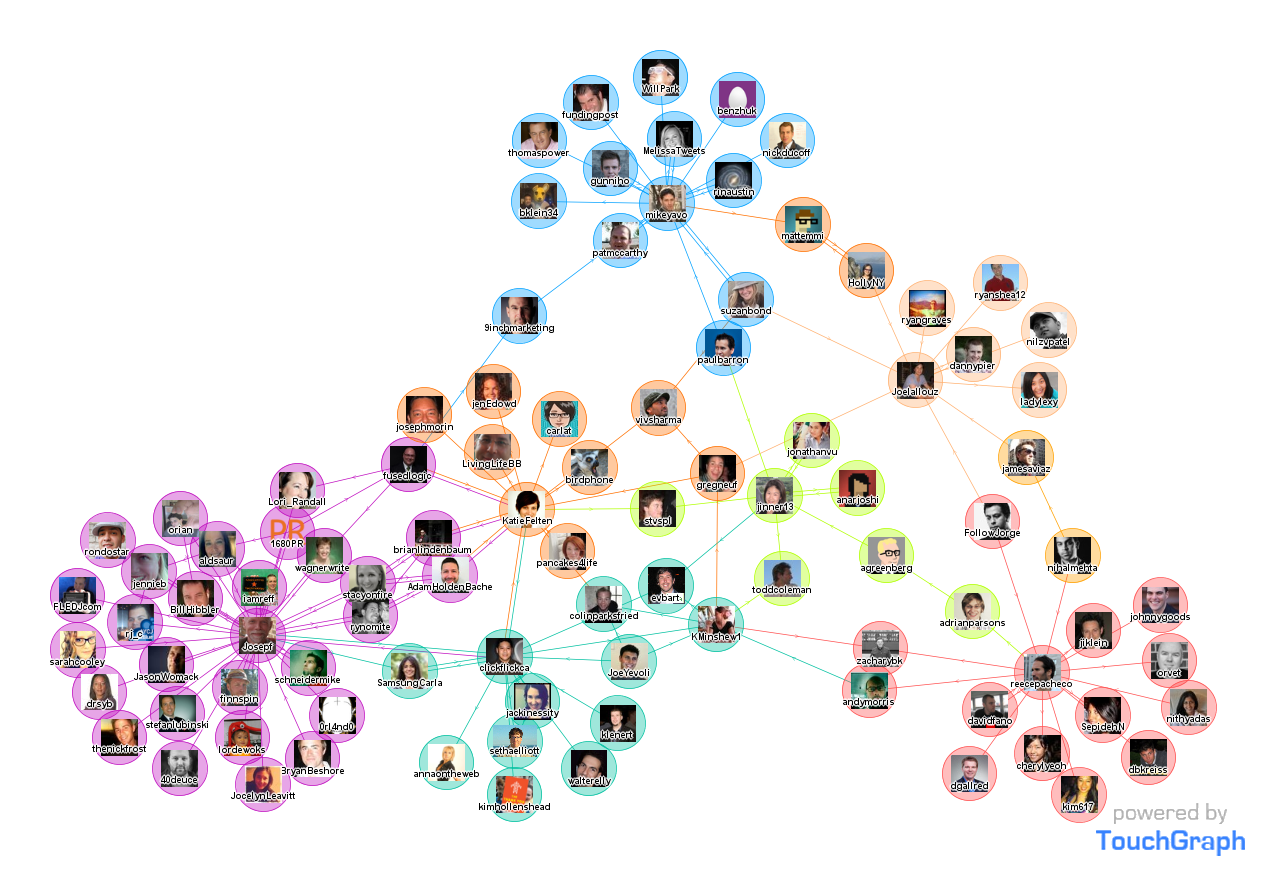
Visualization is to form a mental image of concept, idea or object. Nowadays many people involve in social network. without visualization we are unable to image how we are related. For example, more than one billion people are using Facebook, relationships build on many different connections. What are the relationship between and what kind of pattern is there? With visualization, it can answer those questions instantly. Visualization also means to make perceptible to the mind or imagination. With different metrics and layout algorithm, visualization truly can help us understand better the numbers.
There are many tools of social network visualization that we can utilize. Besides Gephi, we learned from this course, Centrifuge offers an integrated suite of capabilities that can help with rapidly understand and glean insight from data sources and discoveries; Graphviz is open source graph visualization software; GraphChi brings web-scale graph computation available to anyone with a modern laptop, etc.
Of course we need understand network properties to have better visualization such as centrality, density, clustering coefficient, reciprocity, and cliques etc. The first, and simplest, is degree centrality that is defined as the number of links incident upon a node (the number of ties that a node has). It is interesting to learn that for positive relations centrality interpret indegree as a form of popularity and outdegree as gregariousness. Moreover, there is betweenness centrality that measures a vertex within a graph whereas eigenvector centrality is a measure of the importance of a node in a network. There are many metrics that we need more practice to understand, utilize, and take an advantage of.

1. Sudha Ram. "Introduction to Networks". Slide 16. MIS 587 Business Intelligence.
2. Kothari, Prasad. "Social Network Analysis".
 All the materials of
this week definitely is new for me and now I understand that network is a
collection of entities and relationships among them
All the materials of
this week definitely is new for me and now I understand that network is a
collection of entities and relationships among them