Sunday, February 18, 2018

All About Networks

Image result for family treeAll the materials of this week definitely is new for me and now I understand that network is a collection of entities and relationships among them and it is a social structure made up of entities and their relationships.  Networks are in our lives. The old days, our relatives, friends, colleagues and all kinds of relationships but no one ever used any type of tools or documents to analyze them and understand how or why. The only interesting thing or document I have ever seen is genealogy or known as family tree that showing how the members of a family are descended and related.Genealogy is China’s unique cultural heritage and has a long history. As I was wondering how and what people would do with the relationships and I found out that actually genealogy is a precious cultural data and it is an irreplaceable research on history, demography, sociology and economics unique features.
Image result for modern social network
Modern networks are very different and there are many social media and social networking service companies. We always lived in a connected world, except we were not so much aware of it. For decades we never perceived connectedness as being quantifiable, as being something that we can describe, that we can measure, that we have ways of quantifying the process. With rapid growth of the internet and the web, global communication, news and all kinds of information, using analytics for the management and reporting of network utilization, we can spot trends and deviations through event correlation and adding context to the enterprise data model.  Analytics-driven service management makes intelligent infrastructure decisions and optimizes service delivery for the enterprise. 

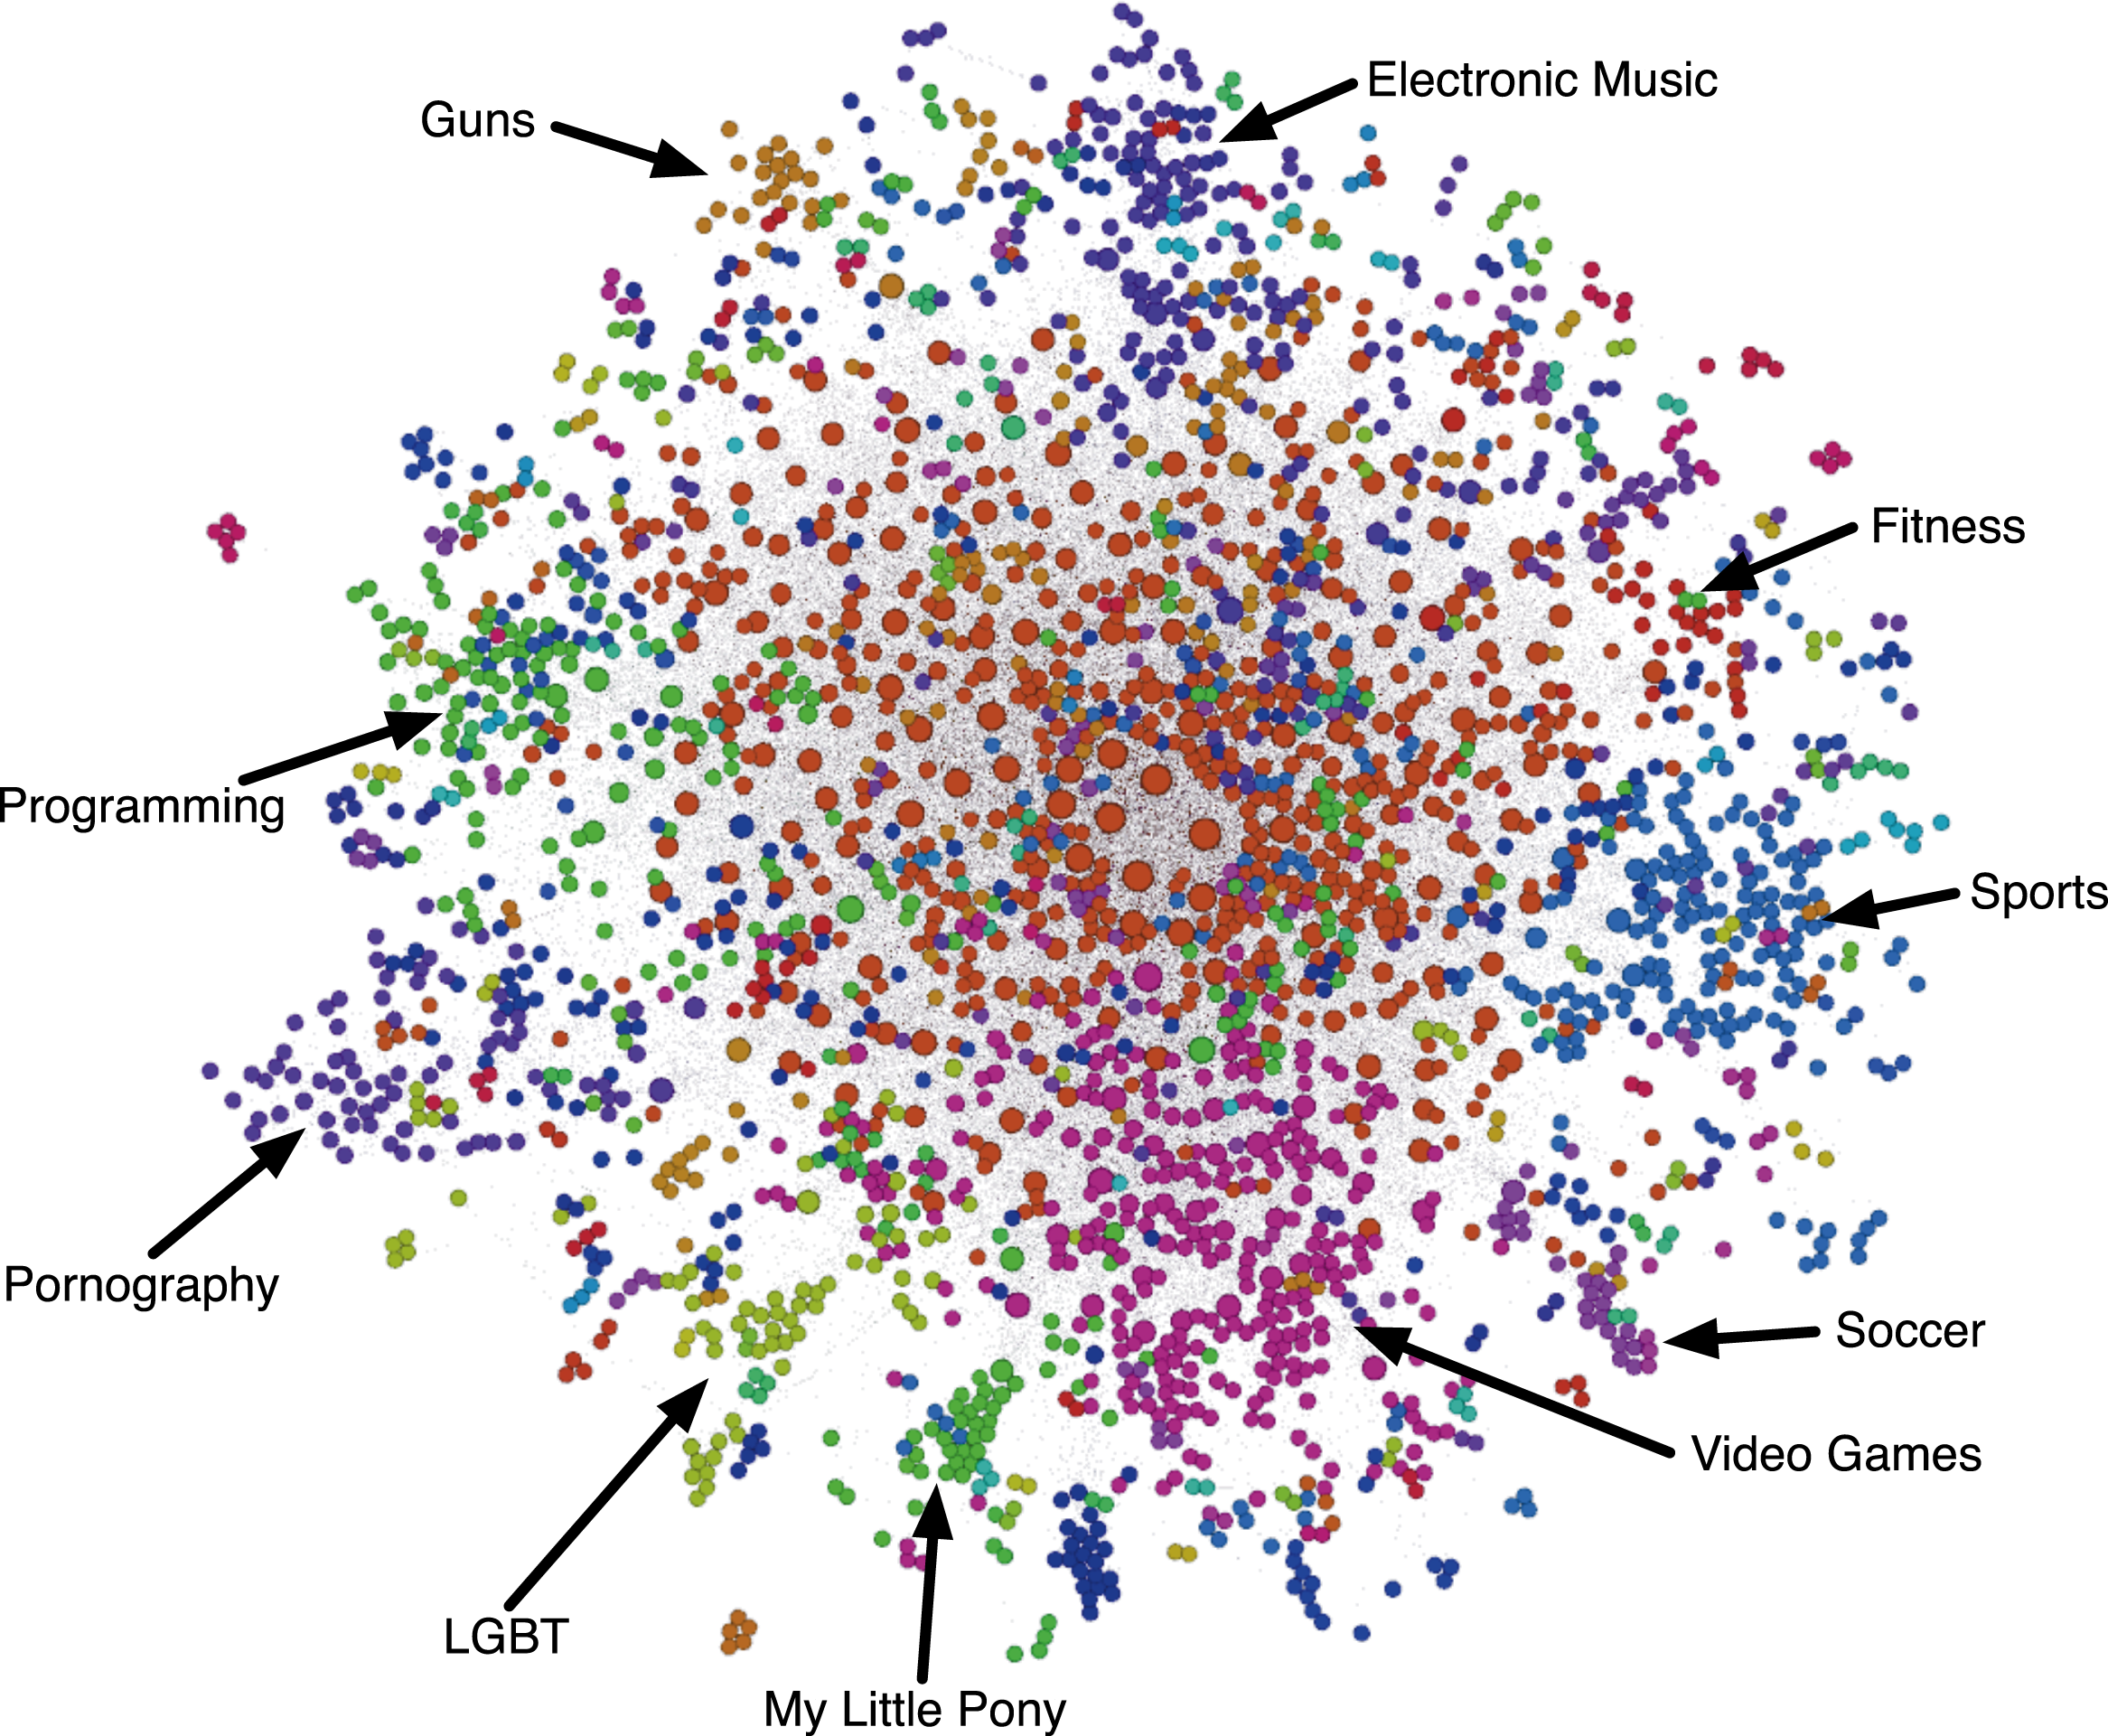
Visualization is a useful technique that represents changes or trends of information and network analysis and we have learned the different ways of networks layouts that can be used to explore datasets, communicate ideas emerging from data, and understand the data and to take action on it. 
 Image result for modern social network visualization

References: 

1.      Ram, Sudha. Introduction to Networks. MIS 587 Business Intelligence
2.      “Automation and analytics play key role in modern networks”. March 14, 2016
3.   “Thinking In Network Terms” Sept. 24, 2012. https://www.edge.org/conversation/albert_l_szl_barab_si-thinking-in-network-terms
2.      Ram, Sudha. “Introduction to Network Visulaization”. MIS 587 Business Intelligence.


Saturday, February 10, 2018

Web Analytic

               Of course we all know Google! When you don't know something, google it, even those elementary kids. As this week we learned about web analytics and Google Analytics, I understand more about web analytics, besides google's powerful search engieer and targeted advertising. We don't need to struggle for sample data any more like many years ago. Nowadays, data is everywhere and I would say from the time before a baby is born and  after of end of life. And most of the data is from internet. Once we have all the data, what can we do?


Image result for Web analytics              Understanding of types of web analytics metrics is important - counts, ratios, and KPI's. As Jason Burby mentioned: count is the most basic unit of measure, ratio typically is a count divided by a count, although a ratio can use either a count or a ratio in the numberator or denominator, key persormance indicator can be either a count or a ratio, it is frequently a ratio. All the metrics come donwn to questions likez: how many visitors do we have? where are they come from? how much purchses do they make? etc. Then we need to understand how to use those metrics to manage and understand our web site.

              Before we do any analysis, it is essential to understand the metrics framework. They are two types: MTC metrics (KPIs) that measures to control and usually answers those question of "How much?", "How Many?", or "How Often"; and MTA metrics that measures to analyze and often to answer why, who, what...? Using the metrics frame to design a comprehensive metrics plan , we can have a clear direction and use MTC and MTA metrics cooperatively for our analysis.
Image result for web metrics
            Web analytics help businesses identify their target audience, improve bounce rate, and increase ROI by aligning resources to right channels / campaigns and many more. Personally I have never had any experience with web analytics and this is perfect introduction course.

            One more thing, I don't like the fact that google's referral is everywhere. Once I search something online, then the related products are everywhere no matter which website I go. Can I stop that? I just want to quietly search on something whenever I neeed it.


References:

1. Burby, Jason, Brown, Angie & WAA Standard Committe. "Web Analytics Definitions". Web Analytics Association. Page 3.

2. Strupp, Paul G. "An Introduction to Web Metrics". Sun Miscrosystems.

Monday, February 5, 2018

Module Two--OLTP vs. OLAP

               In the past few weeks we have had a lot of materials that covered--data warehouse design cycle, balanced scorecard, dimensional modeling, star schema design, and dash board design. Especially data warehouse design remind me a meeting a couple years ago.

              As we know, there are two major types of organizational information, operational database and data warehouse. Many companies they directly use their operational information and also many companies are using data warehouse, meaning OLTP (Online Transaction Processing) vs. OLAP (Online Analytical Processing). The meeting I had a couple years ago, a project manager suggested that we must generate reports from data warehouse ( the company didn't have one), but one of the developer asked why not we cannot directly use OLTP data. No one answered.

In OLTP database there is detailed and current data, and schema used to store transnational databases is the entity model ( usually 3NF). OLAP is characterized by relatively low volume of transactions.  Many small organizations often directly access data from their Online Transaction Processing systems. Directly using Online Transaction Processing system can save money for small organizations. They don't have the budget for many IT staff and expensive applications. The primary advantage to query data and generate reports is speed to information. The data accessed in the Online Transaction Processing system is the "raw" transaction data, and the queries are often less complex. Of course there is no need separately maintain a data warehouse. The disadvantage of reporting directly against  Online Transaction Processing database is it slows down the process apparently.

           Using Online Analytical Processing in business intelligence helps to organize huge amount of information for end user and perform efficient data analysis. The main advantage is the speed of query execution. Often we hear from work, the report is take too long. By using correctly designed cube, reports usually process very fast, just a few minutes.


References:
1. http://datawarehouse4u.info/OLTP-vs-OLAP.html

2. https://galaktikasoft.com/ranet-olap/advantages-of-using-olap-for-business-intelligence.html

Network Analysis and Visualization

As time goes by, network analysis is the last material of this course. Networks are very important because they help us understand ...